You’ve probably heard that there are billions of pages on the web that embed structured data describing products, events, people, organisations… One of the most popular mechanisms for doing this is JSON-LD which is one of the many ways of serialising triples. Since you’re here, I’m sure you know that triples form graphs and that I like exploring graphy things…
In this QuickGraph I’ll have a look at the brand new White House pages and use Neo4j and neosemantics to analyse the structured data they embed.
Extracting the hidden (mini)graph in a web page
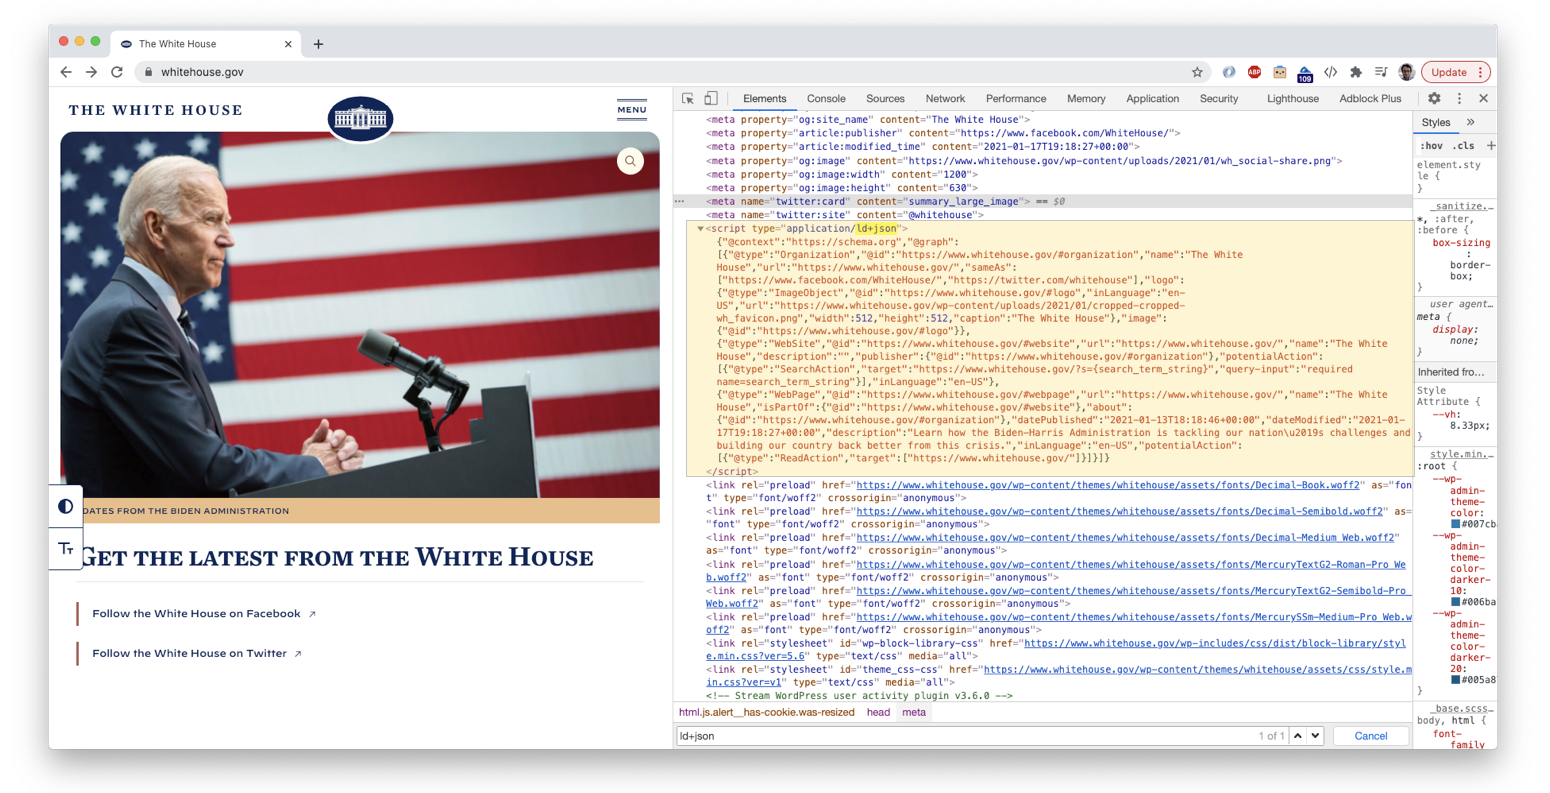
Let’s start by having a look at the HTML of the White House home page. We see that on the head section there is a script element with type="application/ld+json" that contains some JSON-LD. See capture below.
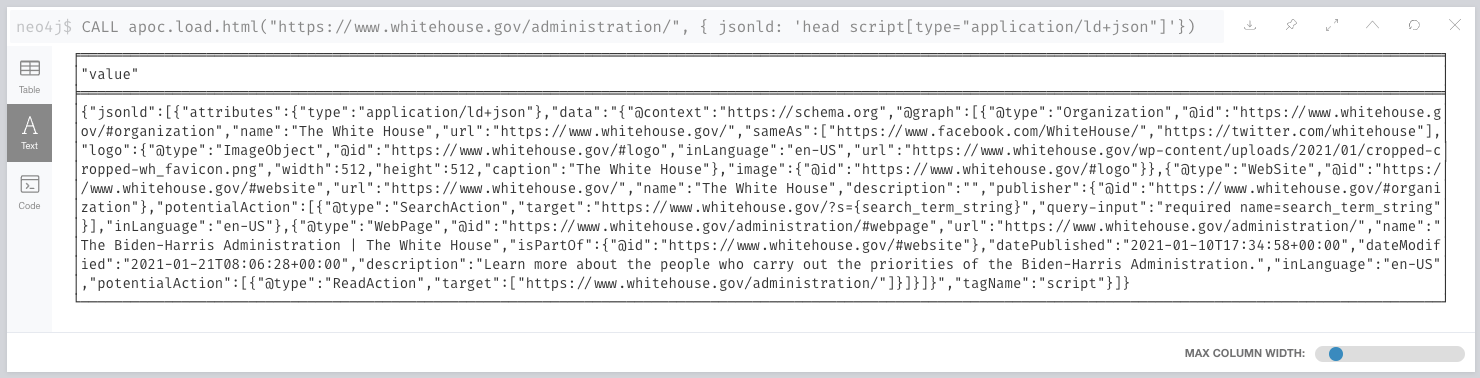
Quite conveniently, APOC’s apoc.load.html procedure offers a pretty simple way of extracting information from a web page. All it takes is the url of the page and a CSS like selector to pick the specific element you’re after. The exact call to the method would look something like this:
CALL apoc.load.html("https://www.whitehouse.gov/administration/",
   { jsonld: 'head script[type="application/ld+json"]'})
Which nicely extracts the JSON-LD that we need.
Visualising the graph
We have a nice RDF plugin for Neo4j called neosemantics (n10s) that can of course read JSON-LD. Actually to be precise, the actual reading is something n10s delegates to RDF4J which is an awesome Java framework to work with RDF. If you are interested have a look at their project.
So if we use n10s to take the output of the previous query and use it to parse the RDF we can see what the graph looks like. Here’s the cypher you’d need to write:
CALL apoc.load.html("https://www.whitehouse.gov/", {
     jsonld: 'head script[type="application/ld+json"]'}) YIELD value
CALL n10s.rdf.preview.inline(value.jsonld[0].data, "JSON-LD") yield nodes, relationships
RETURN nodes, relationships
And this is the preview that you’ll get if you run it in the Neo4j browser:
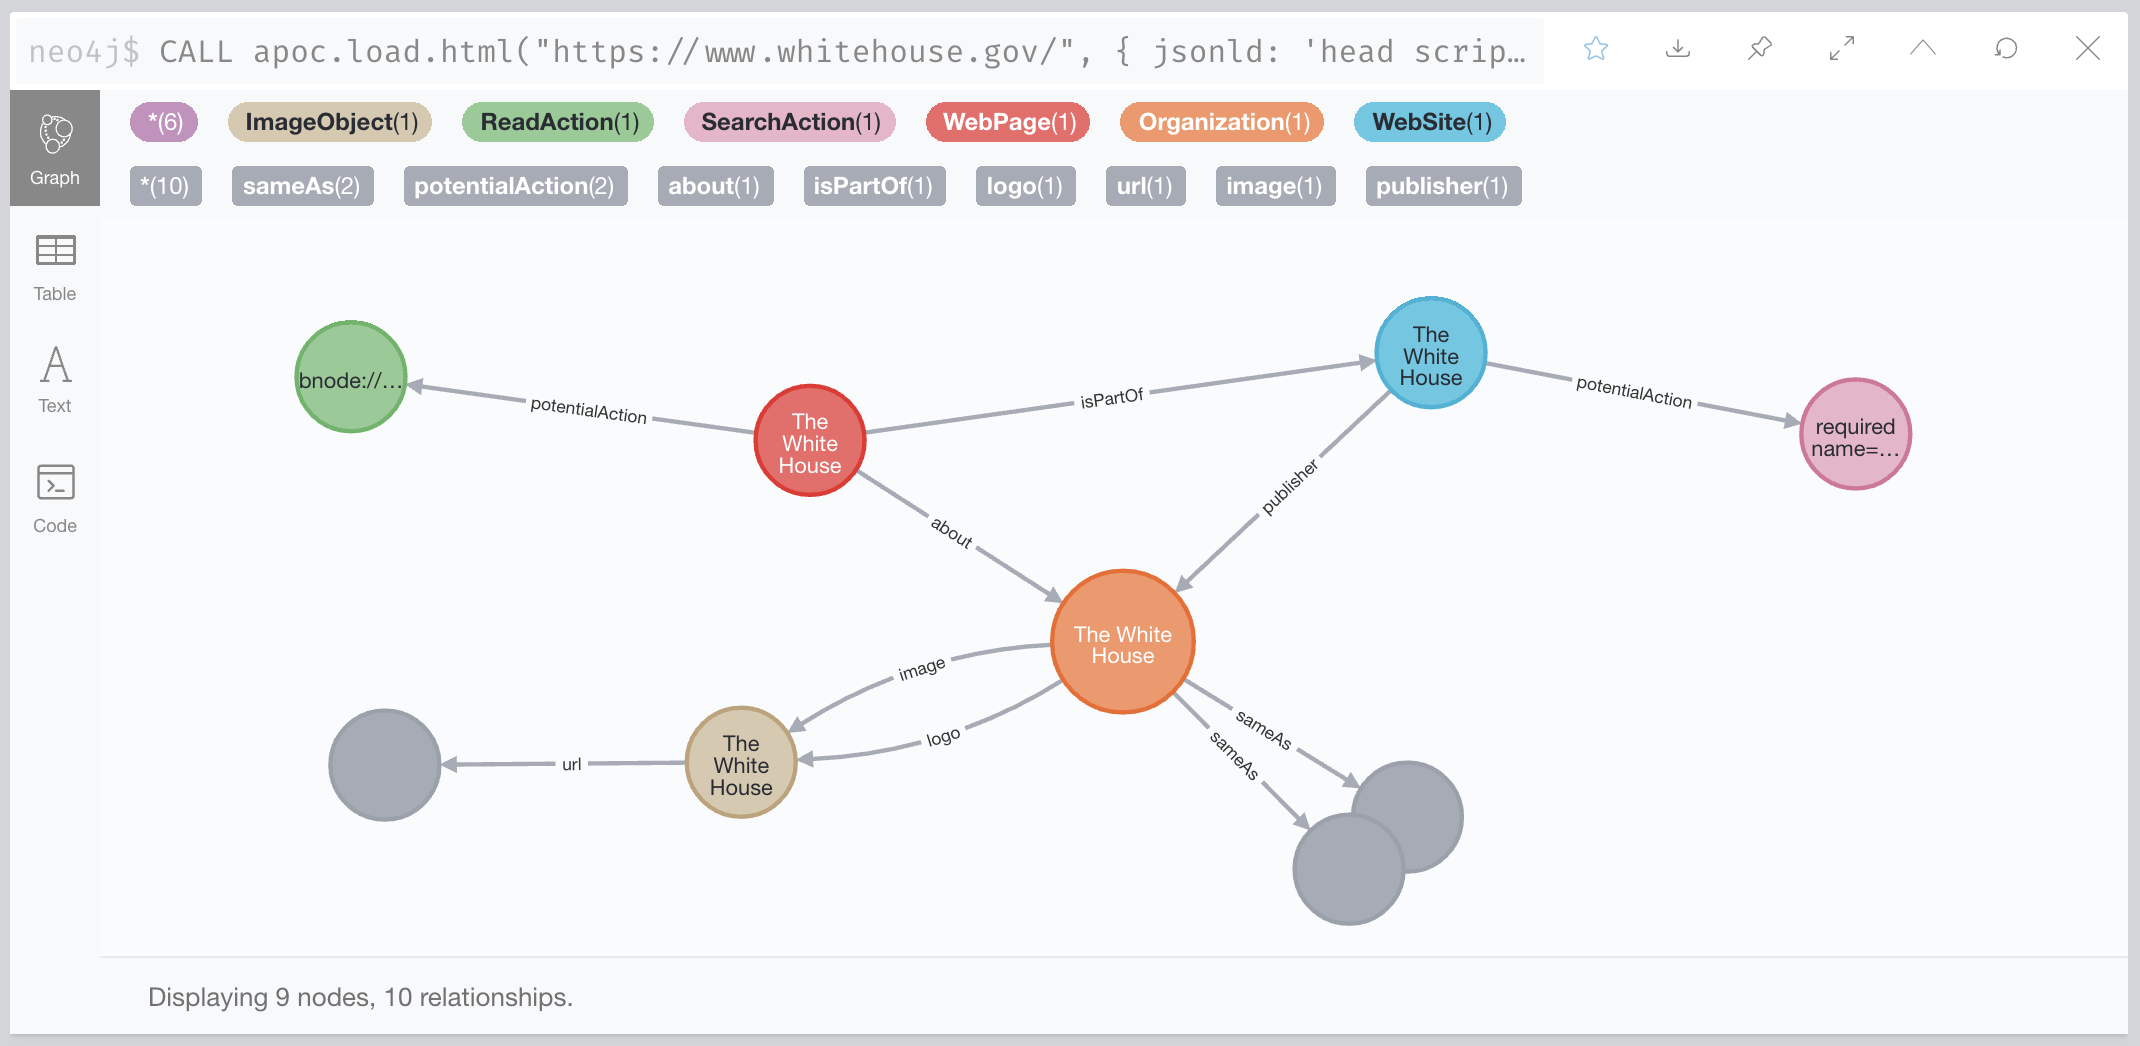
Nice and simple, right? The JSON-LD fragment uses the schema.org vocabulary so all the elements in the graph schema come from there: WebPage, WebSite, ImageObject, isPartOf, potentialAction, etc. If you want to understand the exact meaning of any of the elements you can find the definitions here.
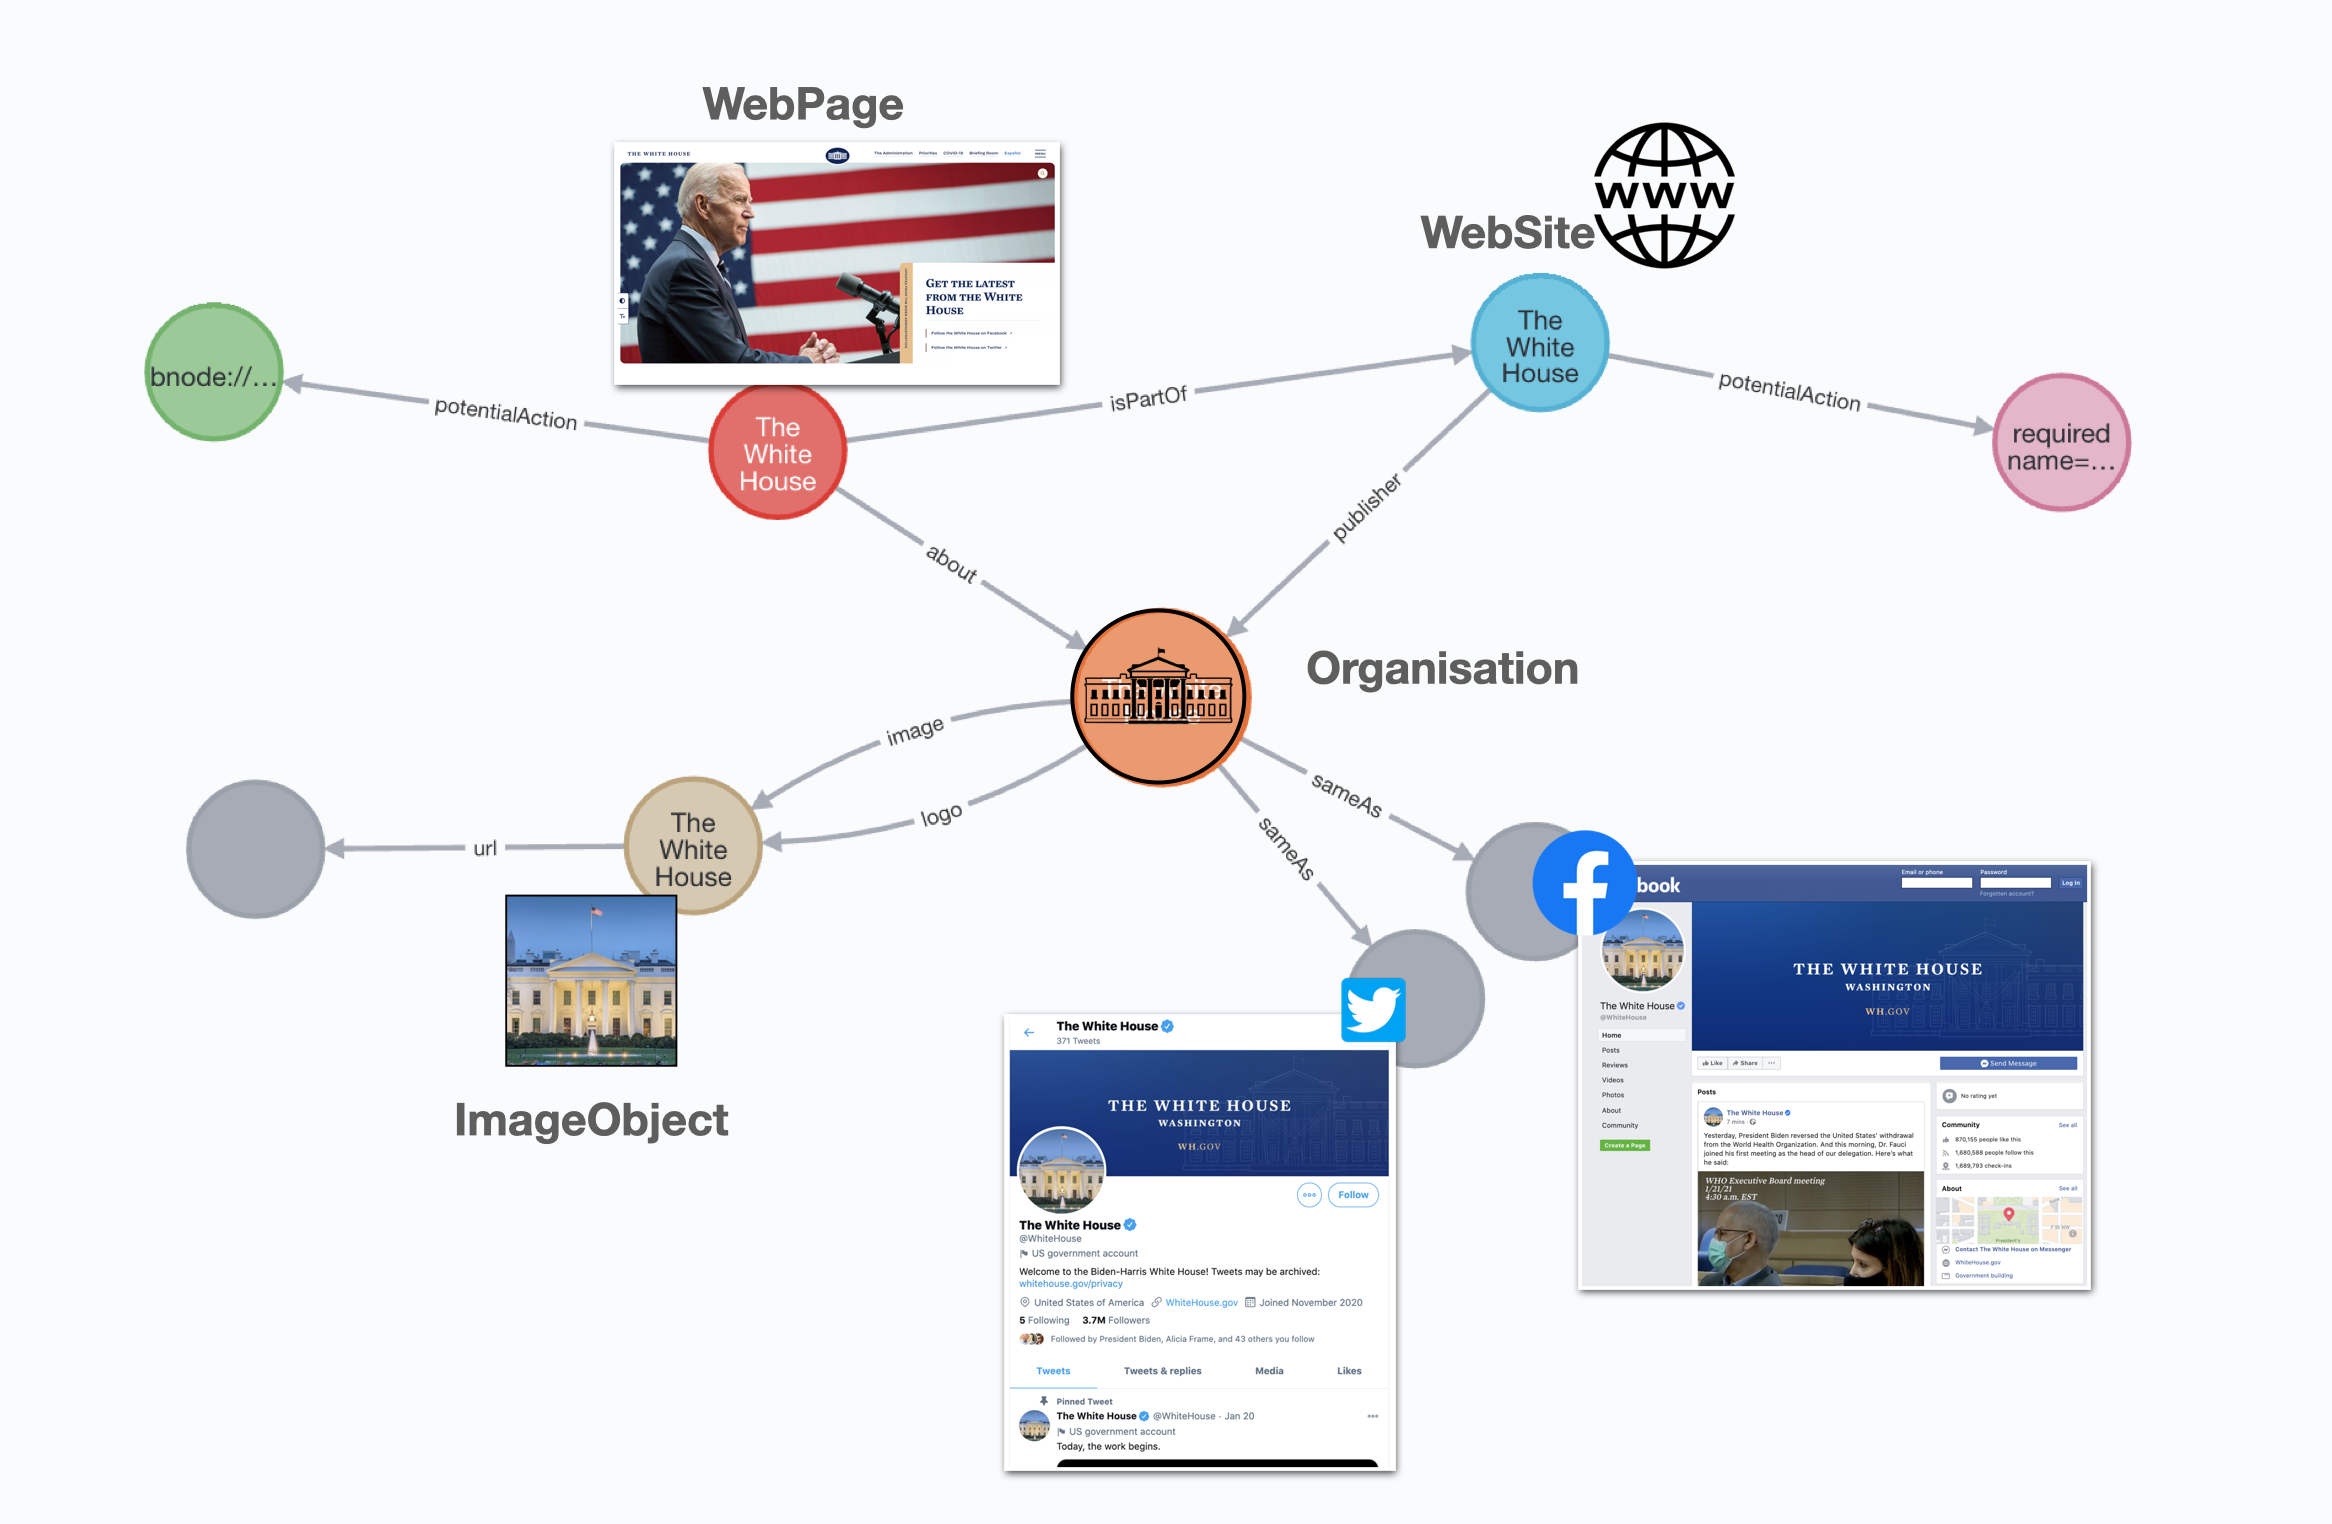
When we analyse the graph in question we see that it’s mostly a description of the web page, the web site that the page is part of and some additional elements like the actions that can be performed on them (Read Action, Search Action) and the logo of the white house with its url. While this is ok, it’s just a description of web documents but not of the concepts they relate to… wait! Both the page and the site link to an Organization. That’s more interesting, an organisation is not a web element, it’s a concept in the real world. It could be an entity in a Knowledge Graph. And interestingly, it has two “aliases” connected to it via sameAs relationships: its twitter page, and the facebook one. In schema.org terms, a sameAs relationship connects an entity to a “reference Web page that unambiguously indicates the item’s identity”.
Persisting the graph and extending it
Let’s see what happens if we save the graph in Neo4j and try adding the mini-graphs contained in other web pages on the White House web site.
We can persist the graph by calling the import instead of the preview method. But other than that, the syntax is identical. We will add an additional fragment at the beginning of our query to make it iterate over the set of pages (in bold) that we want loaded:
UNWIND ["https://www.whitehouse.gov/", "https://www.whitehouse.gov/administration/president-biden/", "https://www.whitehouse.gov/administration/vice-president-harris/", "https://www.whitehouse.gov/administration/dr-jill-biden/", "https://www.whitehouse.gov/administration/douglas-emhoff/",
"https://www.whitehouse.gov/administration/cabinet/"] as page
CALL apoc.load.html(page, {
jsonld: 'head script[type="application/ld+json"]'}) YIELD value
CALL n10s.rdf.import.inline(value.jsonld[0].data, "JSON-LD") yield terminationStatus, triplesLoaded, triplesParsed, extraInfo
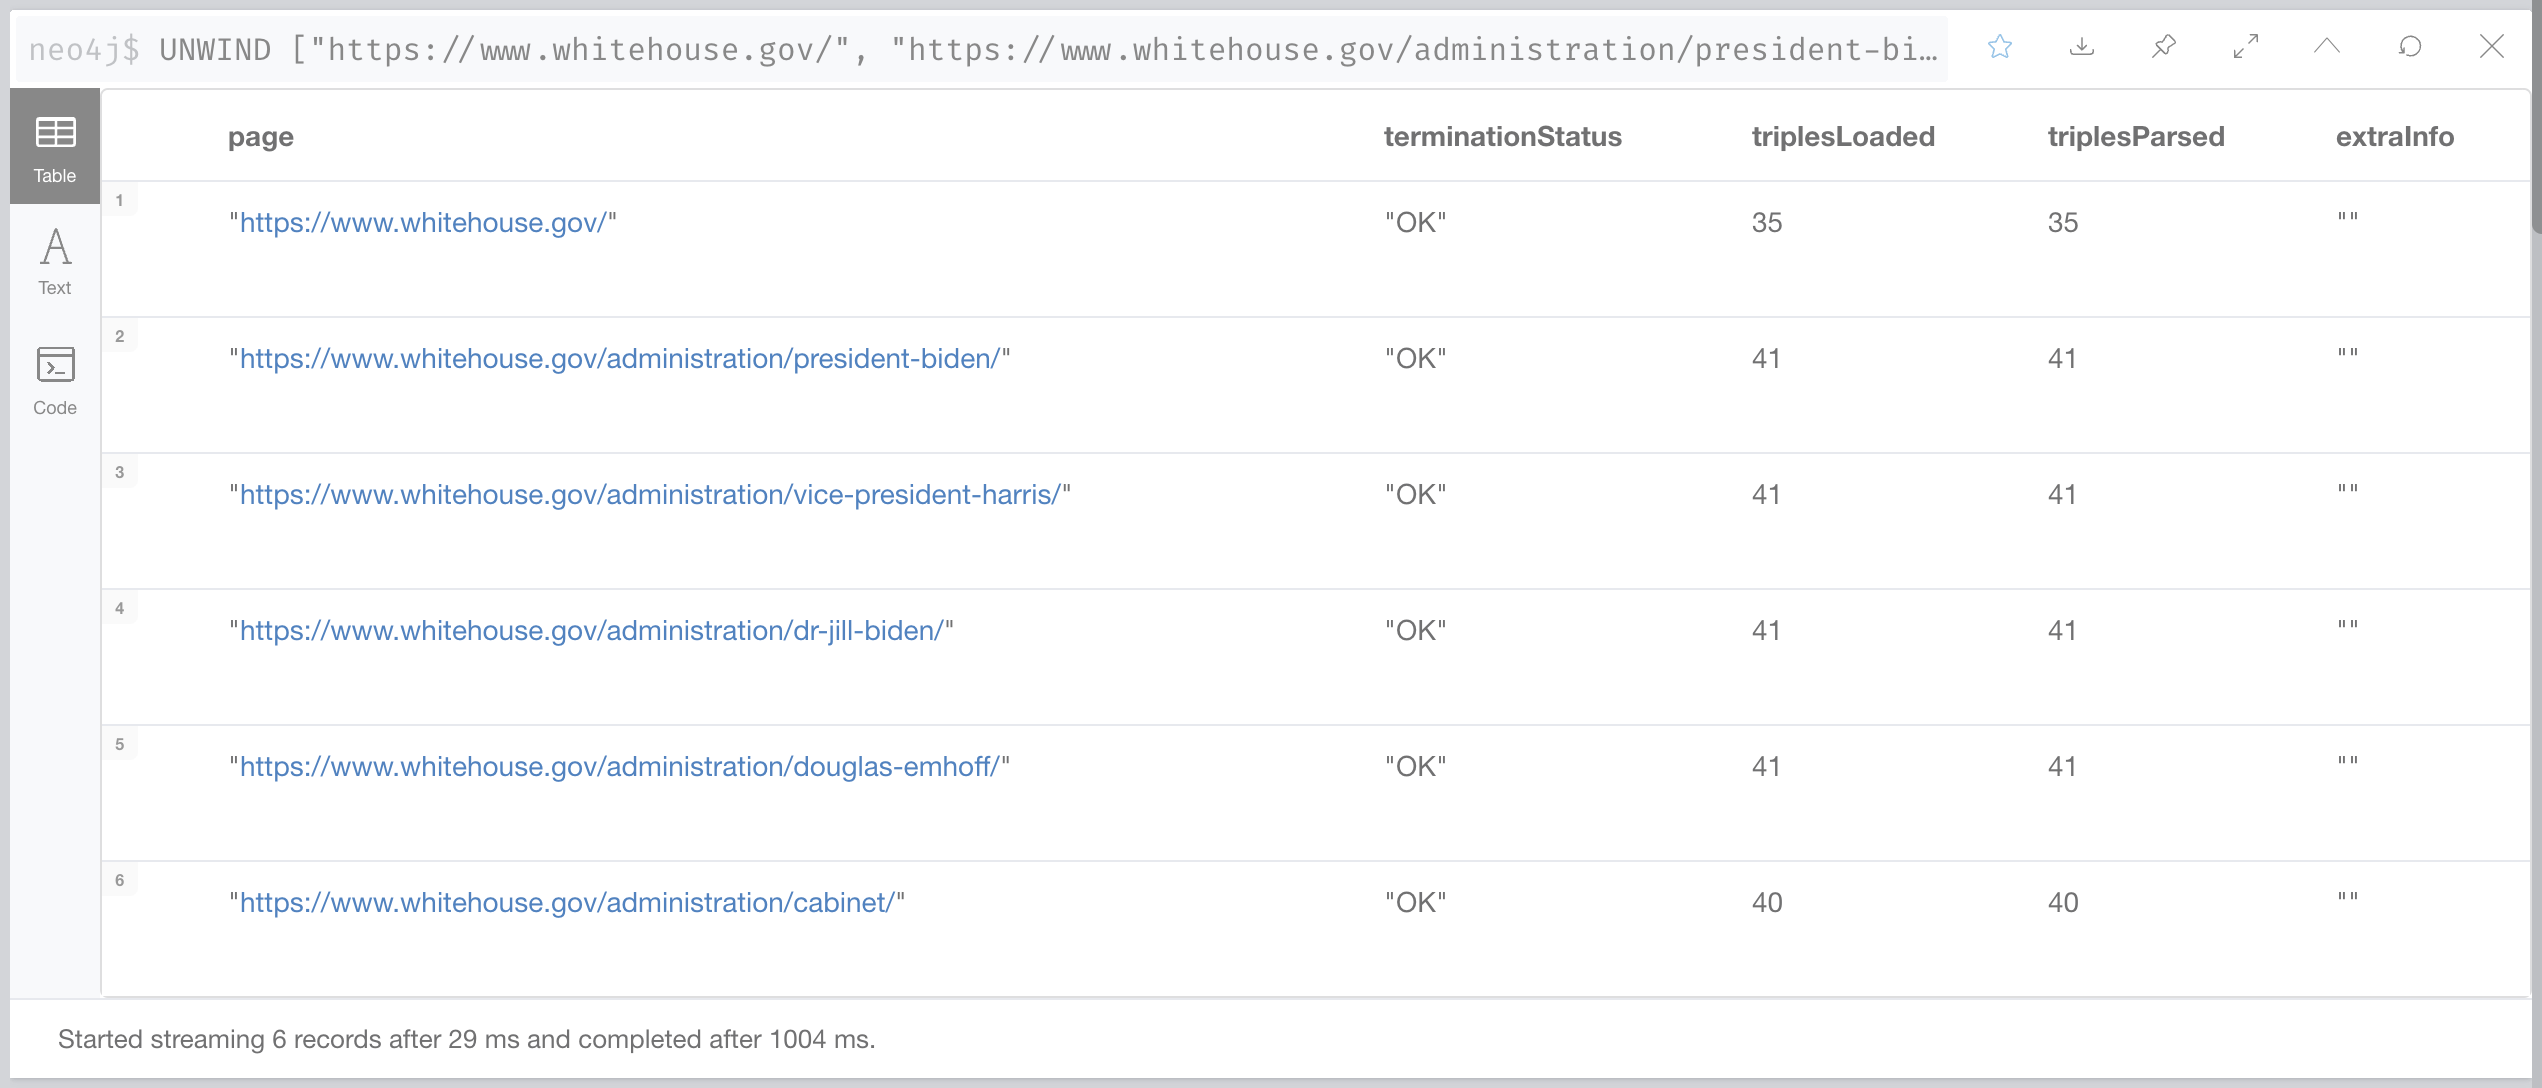
RETURN page, terminationStatus, triplesLoaded, triplesParsed, extraInfo
The import method returns a summary of the execution of the import. Number of triples imported, error message if anything goes wrong, etc.. here’s the output of the previous query:
Let’s have a look at the complete graph now:
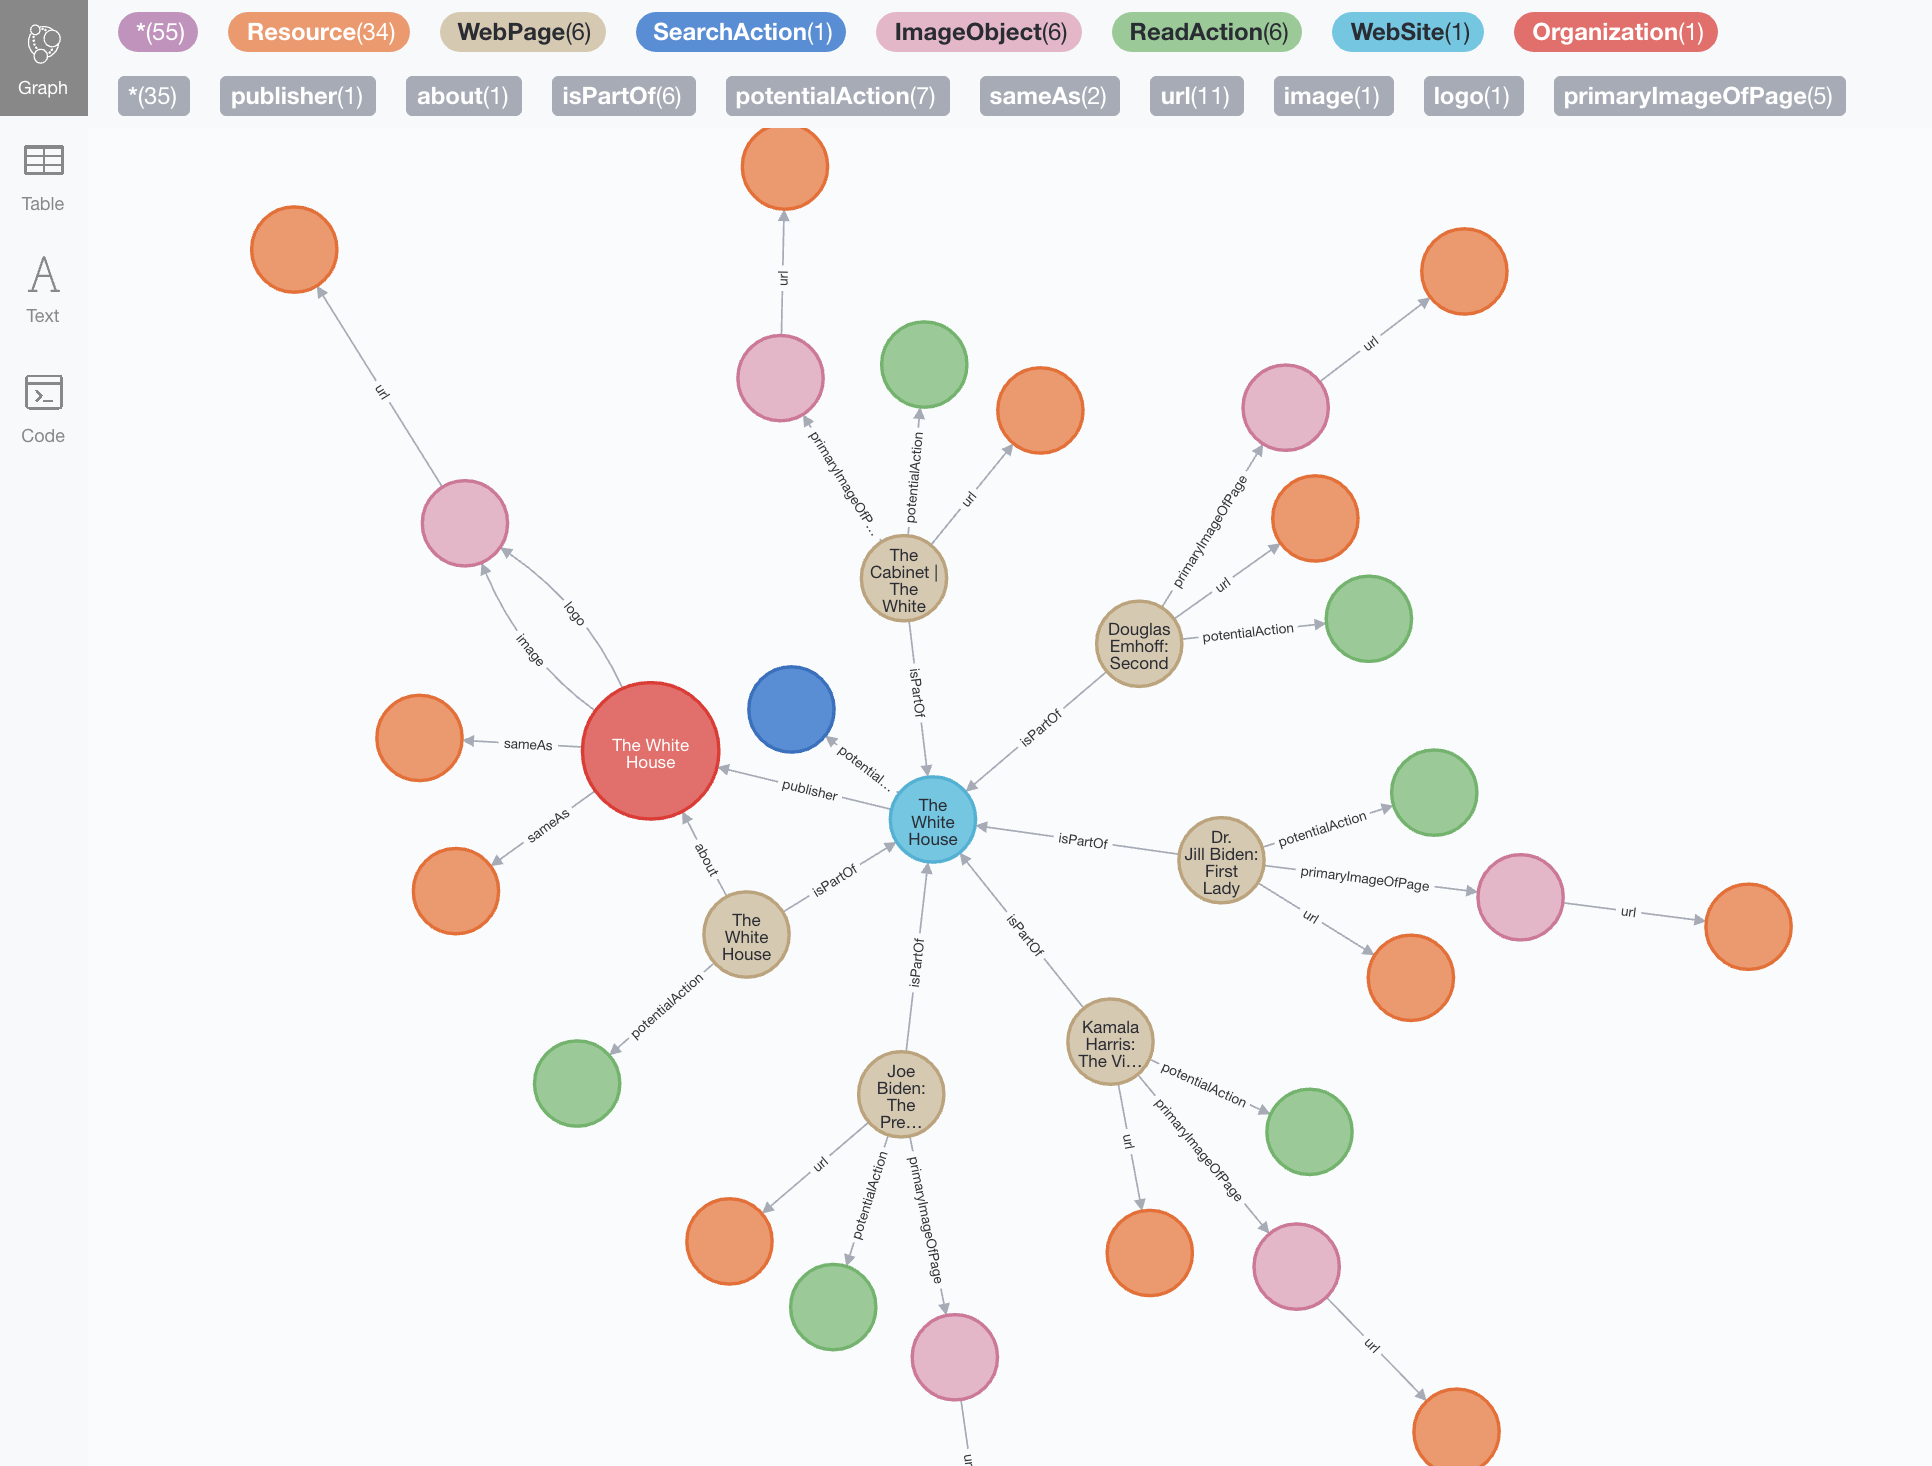
Well… I see a WebSite in the centre, and around it a constellation of WebPage nodes with their associated Actions and ImageObjects… but no Person entities or other more interesting relationships. So the Organization entity was the exception.
What’s interesting about this QuickGraph?
I found it amazing how quick and easy it is to extract a graph from any web page embedding structured data in JSON-LD form. APOC and n10s make it literally a two line job.
Also not great, but still interesting is to find that embedding structured data in a web page does not necessarily translate into exposing linked semantic entities. We have seen how the graph of the White House is effectively a description of the pages on the web site but not really a contribution to the web of linked data or to a knowledge graph of any sort I’m afraid.
Is the White House site representative of the “billions of pages embedding RDF” or there’s better stuff out there? We’ll find out in future QuickGraphs 😉
Now get the latest releases of Neo4j and n10s, and give it a go. You will find all the info you need in the user guide. When you’re done, share your experience or your questions on the neo4j community site.
Thanks for your interest, see you in the next QG.
